Tuesday, October 18th
Overview: During the last few years, data visualization has become increasingly popular in the digital humanities. This week, we’ll consider one way to visualize time. We’ll then ask where and when such a visualization would be not only useful but also problematic. How does the construction of timelines intersect with other scholarly practices (e.g., writing), and what does it mean to work with computers in the spatiotemporal representation of history? For instance, when creating an interactive timeline, what should a digital humanities practitioner know?
Reading Due: (1) “Build Your Own Interactive Timeline” by Brian Croxall, and (2) “Information Visualization: Challenge for the Humanities” by Maureen Stone
Suggested Reading: (1) “Digital Visualization as a Scholarly Activity” by Martyn Jessop, and (2) “The Trouble with Timelines” (including the “Timeline of Timelines”) by Daniel Rosenberg
Suggested Viewing: “MIT Hyperstudio’s 2010 humanities + digital Visual Interpretations conference” (of note: SIMILE was originally designed at MIT)
Assignment Due: Outside of class (either individually or in your cluster), start building a timeline of your evidence using (with help from Croxall’s module) Google Docs and SIMILE. As you build the timeline, consider what’s missing from your evidence. What gaps are there? Also consider how effectively your timeline communicates or represents the issue you are researching. What arguments does it enable? Foreclose? During the lab, we’ll fine-tune the timelines and share them.
Outcomes: Collaboratively construct (or finishing constructing) a SIMILE timeline (one per cluster) using Google Docs, receive feedback on it, and revise accordingly. Determine how (or whether) to integrate the timeline into your proof of concept.
Friday, October 21st
Overview: When we visualize time—or we turn it into space—what happens to interpretation? What is lost and gained? In humanities research, what are the implications of time-stamping events? Artifacts? People? When people use timelines on the web, what might they assume about it? In short, what makes a persuasive timeline?
Reading Due: (1) “Humanities Approaches to Graphical Display” by Johanna Drucker, and (2) “What Is a Date?” by Christopher York
Suggested Reading: SIMILE Timelines at (1) Island Imagined, (2) The Life of Monet, and (3) Jewish History. (There are many more on the web, too.)
Assignment Due: Blog Entry #4 (question circulated during class on Tuesday, October 18th). Also, in light of Drucker’s critique, be prepared to explain to the class how dates and time are being represented in your own project. What liberties are you taking? How (if at all) are you rendering time homogenous? To what effects?
Outcomes: Articulate a rationale for your cluster’s representation of time. If possible, determine how to account for ambiguity (e.g., temporal ambiguity) in your project.
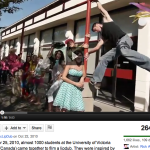
Index image of a SIMILE timeline created by Jentery Sayers. Includes an image of a Lights of New York poster.